
The Indian Housing Market represents a rather unusual trend when it comes to price comparisons and fluctuations. Different policies and schemes of the government influence the housing price trends in a very distinct manner. Demonetisation, for instance, had a big blow on almost all sectors of the Indian economy. However, while the sales went down, the housing market and its prices were hardly affected by the economic decision.
With price fluctuations due to macro- and micro-factors, recording and analyzing housing price trends and measuring the movement of property prices within geographic boundaries became important. For this, a unique and comprehensive index called NHB Residex was rolled out in 26 Indian cities in the year 2007. In the following paragraphs, we will have a detailed look at the key features and nuances of the NHB Residex.
What is NHB Residex?
Short for ‘National Housing Bank,’ the NHB Residex is India’s first and the official housing price index. It aids in tracking and evaluating housing prices across Indian cities based on a set of benchmarks as set by a technical advisory committee. The index presents its deductions based on data that is collected from banks, home finance companies and market surveys.
Originally flagged off in July 2007, NHB Residex was discontinued in 2015 before being reintroduced in July 2017. It has now expanded to a base of 50 cities from the initial 26. This number is expected to rise to 100, in order to bring a larger number of cities under its purview. Additionally, from April 2018, a new series with FY 2017-18 was taken as the new base year. for computing the index.
Which Indices Fall Under the NHB Residex?
Currently, the NHB Residex presents quarterly Housing Price Indices (HPIs) and Housing Rental Index (HRI) across the cities it tracks. The HRI tracks changes in rental property prices per quarter and helps in comparing prices that different tenants are charged over time. The HRI, however, is distributed across two categories –
- Market HPI
- Assessment HPI
Any property that is under-construction and whose data is collected through information gathered from the developers falls under the Market HPI. On the other hand, the data collected through a survey of banks and financial companies or the data related to home loans falls under the Assessment HPI. Here’s how the HPI is further bifurcated.
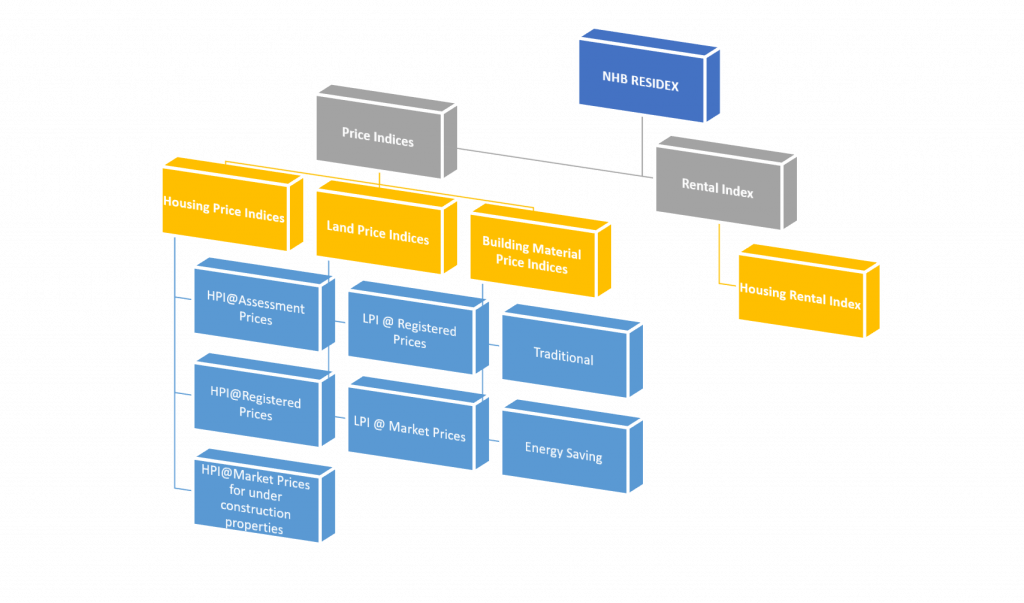
1. Housing Price Index (HPI)
HPI represents the change in prices of residential housing properties. Depending on the nature of source used for data collection, the following four indices have been classified.
- HPI@Assessment Prices use valuation data of banks/ HFCs
- HPI@Registered Prices use registration data of states/ UTs
- HPI@Market Prices for under construction properties
2. Land Price Index (LPI)
Land acts as a raw material for commercial and residential real estate activities. Hence, calculating the details becomes critical. With LPI, the changes in land prices across cities in the country are observed, computed, and bifurcated into the following:
- LPI@Registered Prices: It tracks the land prices of a city based on the registration of transactions during a particular period.
- LPI@Market Prices: Based on the market price of land in various parts of a city.
3. Building Materials Price Indices (BMPI)
Building Materials Price Indices indicate the changes in the building material prices. Like LPI, the BMPI is also bifurcated into two indices:
- Traditional BMPI@Market Prices: It records the price movement of traditional building materials such as cement, brick, etc.
- Energy Saving BMPI@Market Prices: This index records changes in prices of energy-saving building materials like glass, fiber, etc.
Why is the NHB Residex Needed?
Rapid urbanization and swift economic growth in the past few years has resulted in tremendous real-estate activity, especially the residential sectors. The rapidly developing suburban micro markets and commercial and IT hubs have resulted in migration from city to residential properties around the area for ease of commutation during employment.
A national index serves the purpose of measuring and understanding the requisite customer needs so that affordable housing can be facilitated or policy-formulation can be undertaken from the government’s end. A well-conducted and structured research-based survey like the NHB Residex, thus, helps create a credible database that assists market processes.
Hence, the index offers benefits for all the stakeholders of the Indian real estate industry. While for developers, the index acts as a standardized tool to understand the market demands. The homebuyers can use the data to check and compare prices before completing the final transactions. Not only limited to end-users and developers, but NHB Residex can also be used by policymakers to track inflation/deflation in the market.
What is the Process Followed to Collect & Compute Data for NHB Residex?
The data for the National Housing Bank Index (NHB Residex) was usually sourced from banks & Housing Finance Companies (HFCs). From 2013-2015, however, the data was collected from the coveted Central Registry of Securitisation Asset Reconstruction and Security Interest of India (CERSAI).
Data Segregation
After collecting data and taking into consideration some underlying notions, the data is segregated in order to present a more comprehensive index. For example, the records which have incorrect values or where there are huge data inconsistencies are removed from the system.
Post that, the Super Built up Area and Built up Area is converted to Carpet Area. For this conversion, the following formula is used:
| Carpet Area (psf) = (Property Area ∗ Unit Conversion Factor) / Area size type conversion factor |
- Conversion of all Market Values to INR
- Conversion of Property Area to sq. ft. from sq.m.
- Mapping pin codes to cities
Data Computation Methods
The following section shall talk in length about the ways used to compute data, which in return will also shed light on the fact that the NHB Residex is, in fact, very distinct from any other index produced by organizations in India.
Laspeyres Method
Recently, housing price Indices are now being computed through the weighted average price method that is referred to as the Laspeyres method.
The Methodology of Repeat Sales
The Repeat Sales Method assesses the difference in the selling prices of a property that has been sold multiple times. In doing so, it analyses secondary market transactions. The Unique Property Reference Number (UPRN) is used for this purpose. While in metropolitan cities, only a primary market (one that is governed by first-time sales of property) reigns supreme, NHB Residex has to resort to other ways of data collection to prepare a housing index.
Hedonic Regression Method
The Hedonic Regression Method uses regression analysis to estimate the price movement of a property, taking into account the different attributes. The method is based on the fact that the price of a commodity in the market is affected by its characteristics, and people’s willingness to buy it will change as these characteristics change. In the case of property and real estate, the following features are considered: building, location, vicinity, social infrastructure, amenities, etc.
Factors Taken Into Consideration to Compute Data
It is a well-understood fact that a lot of different variables play in when the cost estimate for property has to be figured. This is because the factors like location, neighbourhood settings, the floor, and the sizes of rooms interact together while determining the real estate prices. As a result, it is equally challenging to prepare a price index that is a detailed inference of the same.
The NHB Residex takes into account all these locality-specific features and certain underlying notions. These include-
- Type of property (e.g. Apartment, land, independent house, etc.)
- Property area and layouts (e.g. Super Built-up area, Carpet Area, etc.)
- Unit of area measurement
- Name of the city, pin code, property address
- Type of transaction (Resale, New Property, Under-Construction property, etc.)
- Date of valuation
- The market value of the entire property (Land & Building)
- Unit of market value measurement
- The stock of properties remains constant over a certain period of time so a quarterly report serves no purpose.
- Unit prices of properties are representative of the respective unique set. This is why NHB Residex is generalized and does not capture property prices that are influenced by the most minute differences.
- Some people believe that the NHB Residex is a redundant initiative and the data presented by the Central Registry of Securitisation Asset Reconstruction and Security Interest of India (CERSAI) is enough to gauge customer demand and policy formulation.
In essence, a shifting pattern of growth automatically leads to a shift in the pattern of consumer demand. This demand is always sustained because of someone who is a first time buyer or who is looking for a place to rent, or who wants to invest in commercial real estate to expand their business or just wishing to buy a plot of land. The NHB Residex ensures that every customer’s individual demands are catered to, by streamlining the process of research and also constructing demand-centric properties. By measuring the impact of various economic trends on purchasing abilities, it ensures that the government is constantly kept in loop with any change in policies and laws that might be required.


